
Filtration is often reaching its limits in the industrial separation of biomass like cells or other micro organisms from e.g. fermentation broth. The cause for that is the over-proportional increase of the filter cake resistance with the filtration pressure, due to the deformability of the cells. In many cases centrifugal separation is the only option to separate the bio product from the liquid.
The following table shows examples of bio products and their settling rate in earth gravity field and at 10000g in fermentation broth.
Particle | Example | Size | Density difference | Liquid Viscosity | Settling rate w0 at 1g | Settling rate w0 at 10000g |
µm | g/cm³ | mPas | mm/h | mm/s | ||
bacteria | E.coli | 1-1.5 | 0.04-0.1 | 1-2 | 0.04-0.4 | 0.1-1 |
yeast | Bakers yeast | 6-8 | 0.04-0.1 | 1-2 | 1.5-10 | 4-30 |
cell debris | E.coli homogenisate | 0.3-0.7 | 0.02-0.2 | 10 | 0.0004-0.02 | 0.001-0.05 |
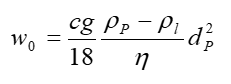
The following equation only allows for the calculation of diluted and fully dispersed systems, which is usually not the case for fermentation broths.
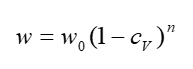
Due to the complexity and the high concentration of the product systems hindered settling needs to be considered. The Richardson-Zaki equation estimates the reduction of the settling rate with increasing concentration as follows:
n has been reported to reach values between 10 and 100 for biological systems already at lower concentrations. At higher concentration, the settling rate cannot be calculated any more. In most cases an extensive lab study needs to be conducted to gain information about residual moisture and clarity of the centrate.
The use of flocculants might be necessary in case sufficient clarity of the centrate cannot be obtained at the envisioned flow rates.
Commonly used centrifuges for bio separation purposes are tubular bowl, multi-chamber, disc stack or scroll decanting centrifuges.
Typical process parameters are stated in the following table:
Centrifuge type | Continuous or batch | c-value | Particle size range µm | Concentration range %Vol |
Ultra centrifuges | batch | 100000-1000000 | <1 | |
Tubular bowl | batch | 20000 | <1 | |
Disc stack | cont. and batch | 15000 – 20000 | 0.1 – 100 | <3-25 |
Decanter | cont. | 5000 | 1 – 3000 | 4 – 40 |
