Quantification of Particulate Contamination by Automated Image Analysis

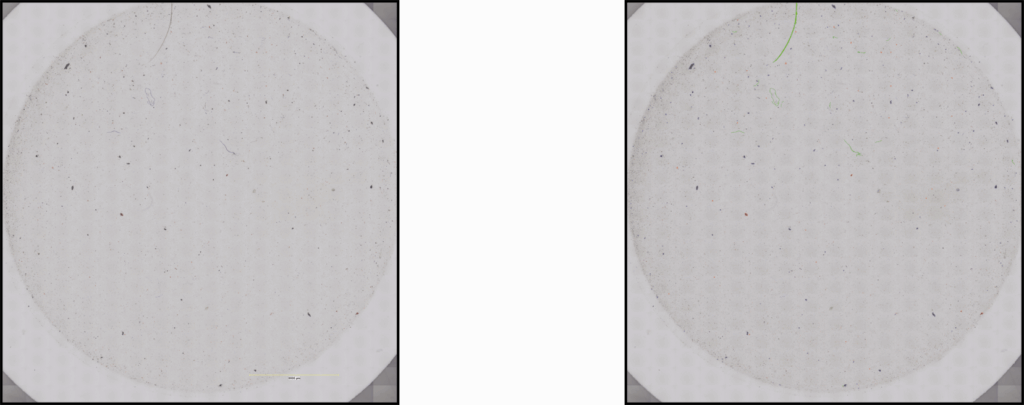
Manufacturers and quality control labs are finding it increasingly essential to guarantee the purity and uncontaminated state of components and fluids. The analysis process of membrane filter residue is simple: fluids, such as oils or solvents, are filtered through a circular membrane. The collected residue is caught by the filter. One method commonly used to observe particulate contamination is by counting and measuring particulates collected on filters using optical microscopy. In quality control laboratories, Automated Image Analysis allows the user to save time and money as well as eliminate subjectivity due to fatigue.
Most particles of interest lie in the range of 3 to 400 microns with fibres that can measure over 5 mm. In standard optical microscopy Image Analysis methods, measurements are usually done on the objects in each field of view and the results are cumulated for the area covered. The challenge lies in the fact that the fibres generally overlap two or more fields of view, and therefore the individual fibres are measured in sections when the standard method is used. Generally, one of two approaches is used to address this: the tiling method, and the mosaic method. Each method has its limitations with respect to time of analysis, precision and memory space required. Usually gains in one area are offset by losses in another.
The tiling method is used with a predefined circular stage pattern, which corresponds to the area of the filter where the particulates are collected. The Tiling method involves two steps of measurements; first, in each field of view the particulates are separated from the fibres based on size and shape factors and the non-fibre particulates are measured. The fibres are transferred by a Tiling function into a cumulative bit-plane. Finally, when the entire area of the sample is covered, the fibres are reconnected and measured. This method is the faster than the Mosaic method and does not require large amounts of memory. It is the most accurate for the measurements of small particulates because of the high resolution used at measurement. Medium and large sized particulates and fibres are measures after Tiling, features in the medium range tend to lose some accuracy because of resolution loss when they are tiled, however the error is less significant on large fibres and particulates. An added benefit of the Tiling method is that one can go back and visualize individual particulates after completion of the test.
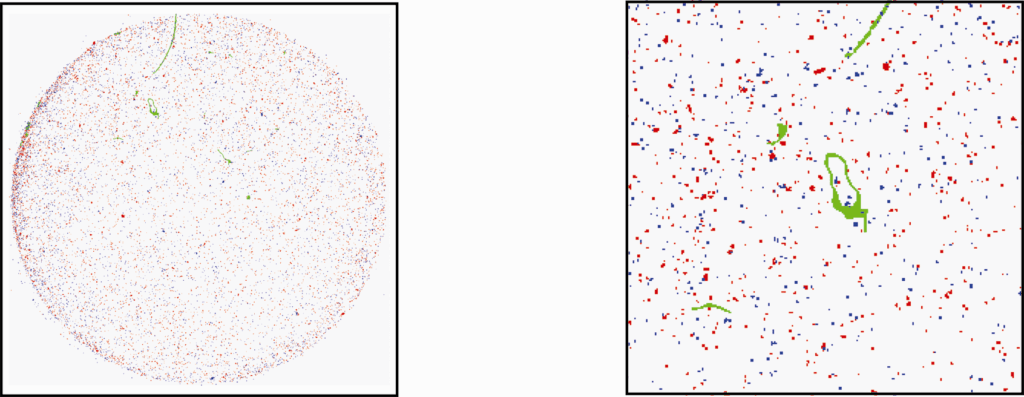
The Mosaic method consists of scanning over the whole area of the sample with a square stage pattern and storing all the original images. Once the whole filter area has been covered, the individual fields of view are stitched together with great precision and the image of the entire filter is assembled. The image analysis is done on the image of the entire sample, where the fibres are not cut into segments. The resolution loss is less significant than in the tiling method for medium and large particulates, therefore the measurements are accurate. However, there is a loss of accuracy for small particles. The Mosaic method also takes about 1.5x the amount of time in comparison to the Tiling method, to analyze the full surface of the filter. An added benefit of the Mosaic method is the resulting global view of the whole filter after completion of the test.
When selecting what method to use, it is good to consider the likely size of contaminants, which ones are most detrimental, and desired turnaround time of the analysis.
Author
Monique Dallaire, ing. MBA
Clemex Technologies Inc.
VP Marketing and Product Development
-
1-888-651-6573 x15
Tags
