One of many ways to characterize fiber mats is by the average fiber diameter distribution. There are many ways to define the average fiber but most appropriate for filter media is the length weighted average fiber size and fiber distribution. Other average fiber diameters are used, such as a number distribution but the number distribution does not account for fibers of different lengths.
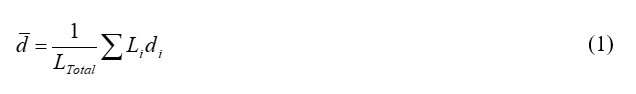
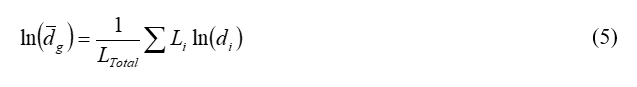
The length weighted fiber diameter is defined as the sum of the fiber diameters times length divided by the sum of the lengths
This average fiber diameter represents the mean fiber size of a distribution of fiber diameters. To determine the frequency distribution you can use images of the fiber mats to measure diameters and lengths. The log normal frequency distribution fits the data better than normal frequency distribution for some applications such as electrospun nanofibers [1].
The normal frequency distribution is given by
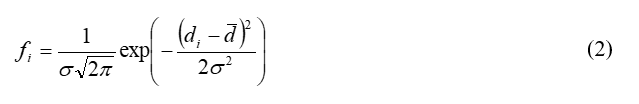
where is the standard deviation
The log normal frequency distribution is defined a bit different as
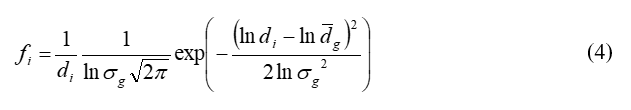
where the log mean diameters is given by
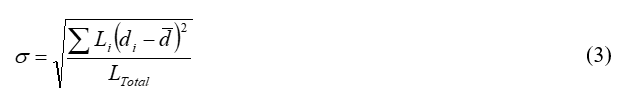
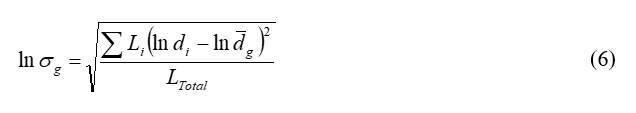
and the log standard deviation is given by
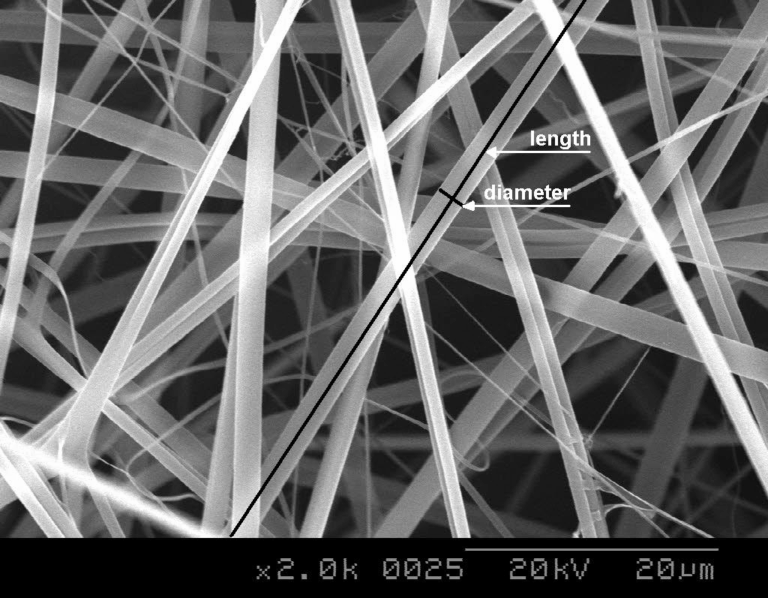
To measure fibers from a microscopic image, there are many free software programs available. In our work we use a program called ImageJ (http://rsb.info.nih.gov/ij/) to measure length and diameter of fiber. This program measures the number of pixels in the picture and the scales lengths according to the calibration provided by the user. The picture in Figure 1 shows an example fiber length and fiber diameter from a Scanning Electron Microscope image.
Multiple images may be necessary to obtain a sufficient number of measured fibers. We suggest no fewer than 300 fibers from 10 sample photographs taken at different locations on the fiber mat.
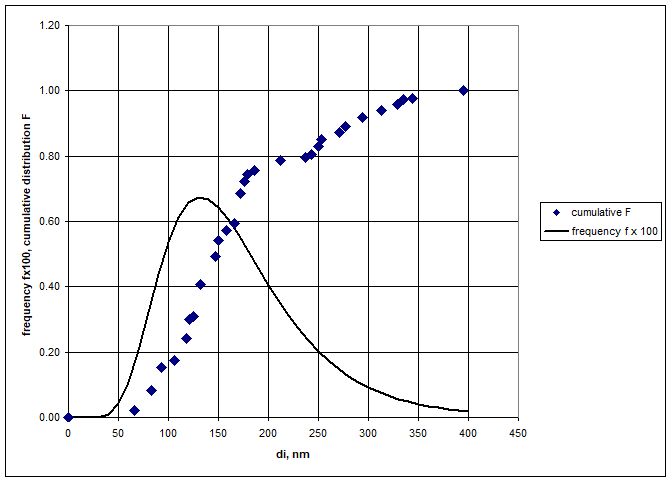
The frequency distribution is the slope of the cumulative distributions as given by
As an example, typical fiber diameters and lengths of fibers of those diameters are listed in Table 1. Using Equations (5) and (6) the log mean and standard deviation are calculated to be
An example frequency distribution (plot of f versus fiber diameter, d ) is plotted in Figure 2 from data the data in Table 1. The cumulative distribution, F, of a fiber diameter di is the sum of the lengths of fibers less than or equal to diameter di,, as listed in the fourth column of Table 1, divided by the total lengths of all fibers.
Table 1. Typical fiber diameter and length data. The fiber diameters are listed in the column di. The total length of fibers of each diameter are in column Li total. The cumulative amount of fiber lengths are listed in the column Cum Li and the cumulative frequency is listed in column F.
di, nm | ln(di) | Li Total | Cum Li | F |
0 | 0.00 | 0.00 | 0.00 | 0.00 |
65.8 | 4.19 | 14.52 | 14.52 | 0.02 |
83.2 | 4.42 | 37.94 | 52.47 | 0.08 |
93.0 | 4.53 | 45.60 | 98.07 | 0.15 |
106.1 | 4.66 | 12.82 | 110.89 | 0.17 |
117.7 | 4.77 | 43.52 | 154.41 | 0.24 |
121.3 | 4.80 | 38.11 | 192.52 | 0.30 |
124.8 | 4.83 | 6.33 | 198.84 | 0.31 |
131.5 | 4.88 | 61.36 | 260.20 | 0.41 |
147.1 | 4.99 | 55.56 | 315.76 | 0.49 |
150.0 | 5.01 | 30.71 | 346.46 | 0.54 |
158.4 | 5.07 | 19.40 | 365.86 | 0.57 |
166.4 | 5.11 | 14.43 | 380.29 | 0.59 |
171.5 | 5.14 | 57.94 | 438.23 | 0.68 |
176.5 | 5.17 | 25.21 | 463.44 | 0.72 |
178.9 | 5.19 | 12.29 | 475.73 | 0.74 |
186.0 | 5.23 | 8.48 | 484.21 | 0.76 |
212.1 | 5.36 | 20.27 | 504.48 | 0.79 |
237.1 | 5.47 | 5.69 | 510.18 | 0.80 |
242.5 | 5.49 | 6.39 | 516.57 | 0.81 |
249.6 | 5.52 | 14.56 | 531.12 | 0.83 |
253.0 | 5.53 | 14.51 | 545.63 | 0.85 |
271.2 | 5.60 | 12.81 | 558.44 | 0.87 |
277.5 | 5.63 | 12.81 | 571.25 | 0.89 |
294.1 | 5.68 | 16.29 | 587.54 | 0.92 |
312.7 | 5.75 | 14.67 | 602.20 | 0.94 |
328.8 | 5.80 | 11.85 | 614.05 | 0.96 |
335.4 | 5.82 | 9.30 | 623.36 | 0.97 |
344.3 | 5.84 | 2.79 | 626.15 | 0.98 |
394.6 | 5.98 | 14.32 | 640.47 | 1.00 |